http://www.nytimes.com/2010/08/15/business/economy/15view.html


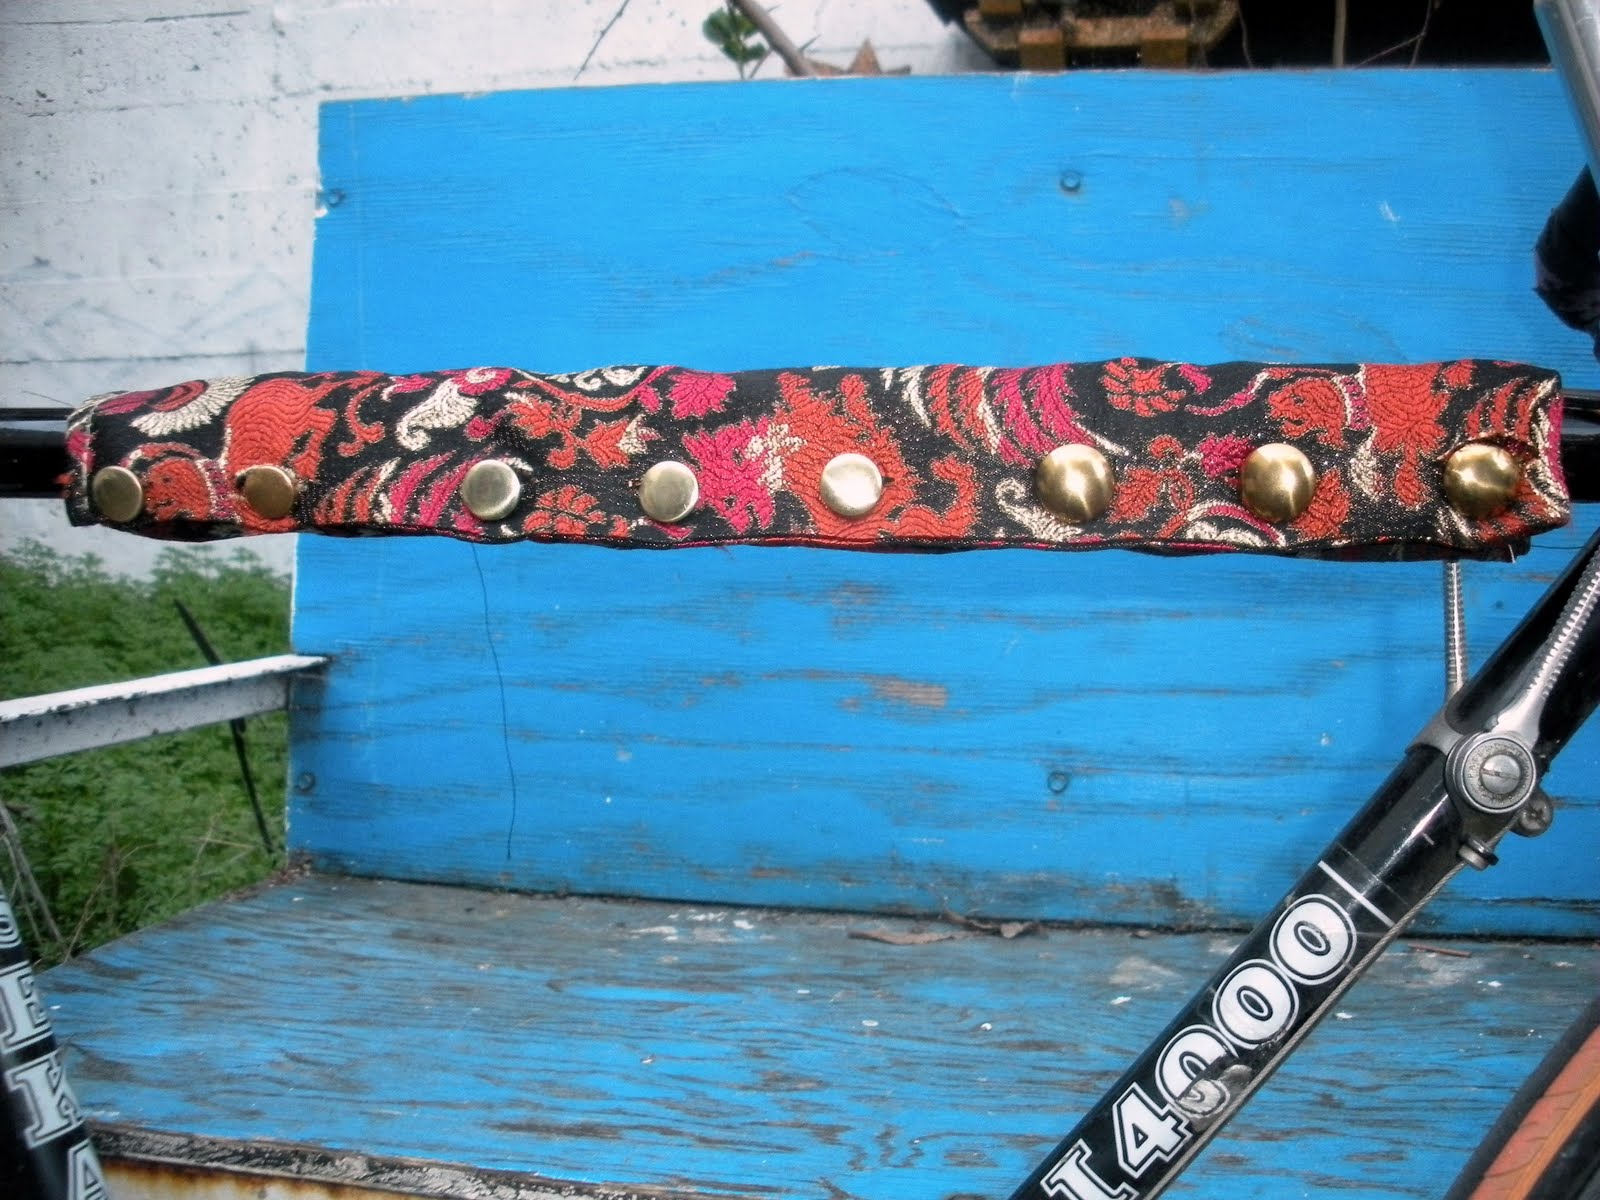
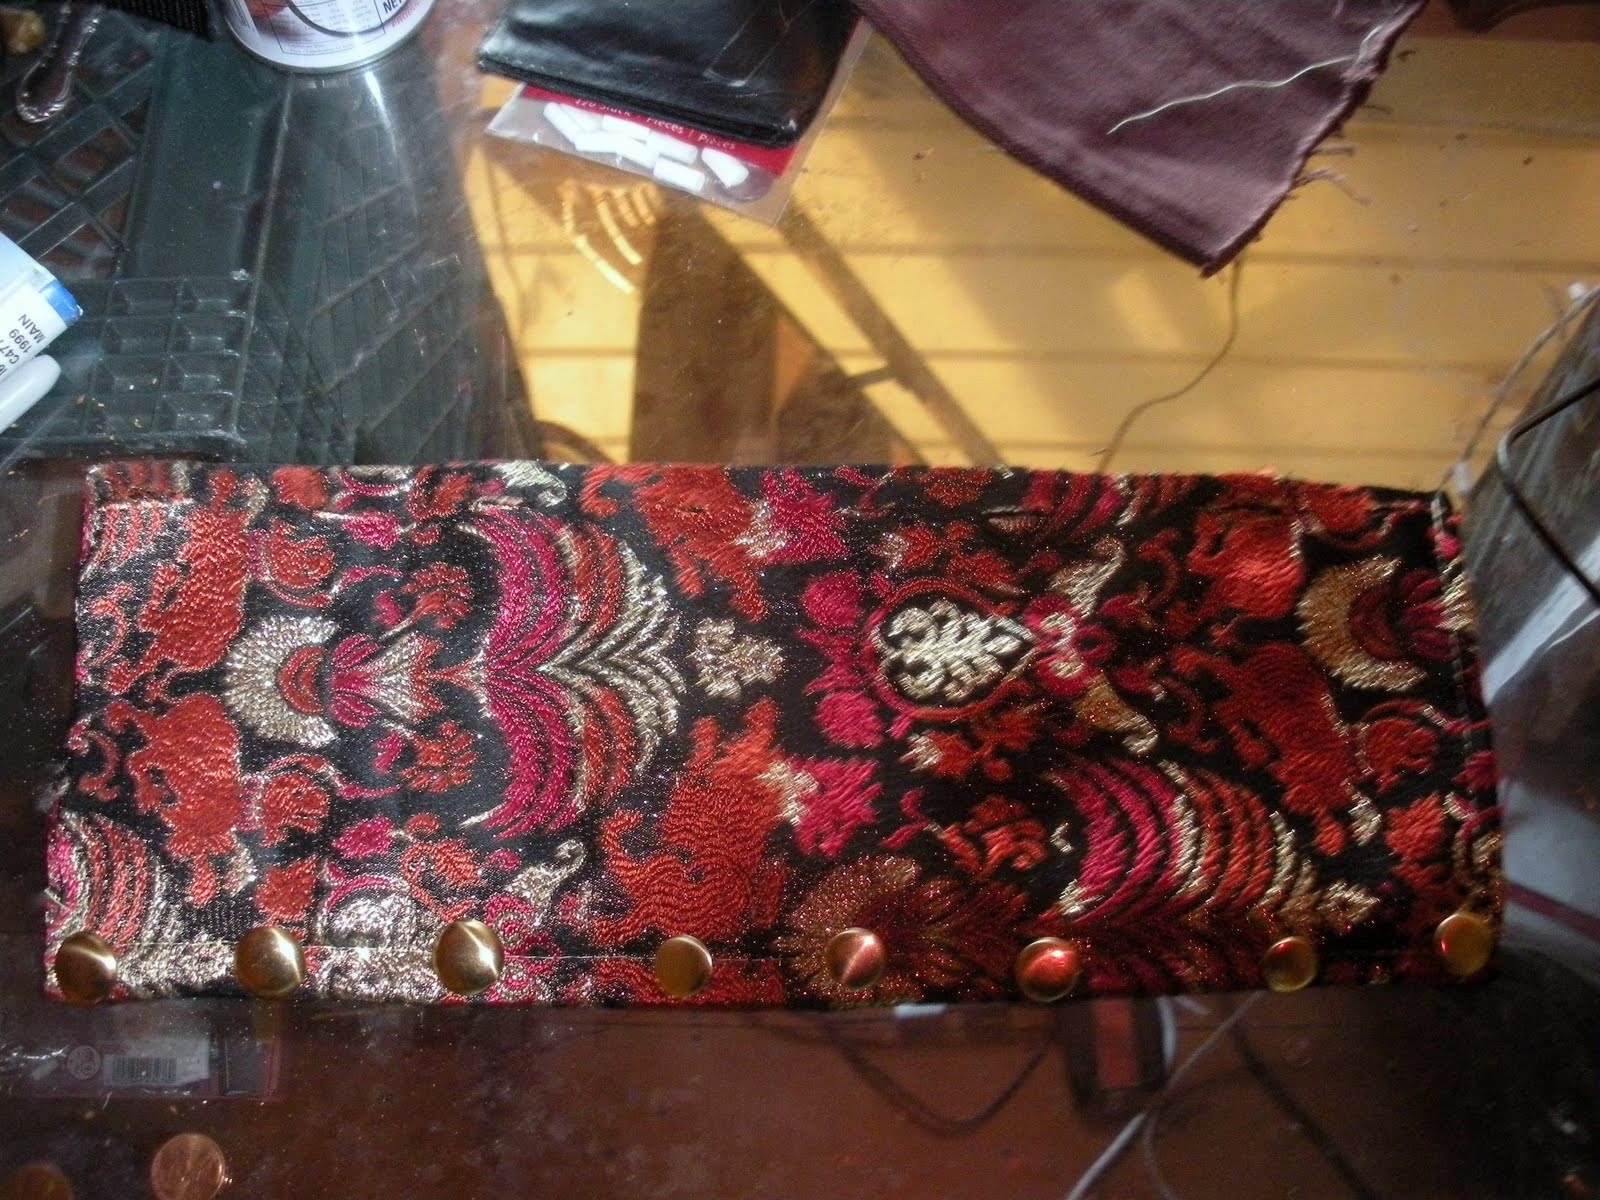
Here are the photos of the pieces featured in the last show


Three booths in the forms of honey combs for 32 hours in public space in central Berlin around the Brandenburg Gate and the Charité Hospital. These sculptures served as mobile video studios inside, where pedestrians were asked to give theirs individual statements to the topic of SUSTANABILITY – Climate Change – Value Change.
A short documentary of the project is available here .
http://www.urbandialogues.de/index.php?page=18/#past_03
I am having an art show at The Layover / DepARTure gallery in downtown Oakland. Opening on March 4th: 1517 Franklin Street & intersection of 15th street.
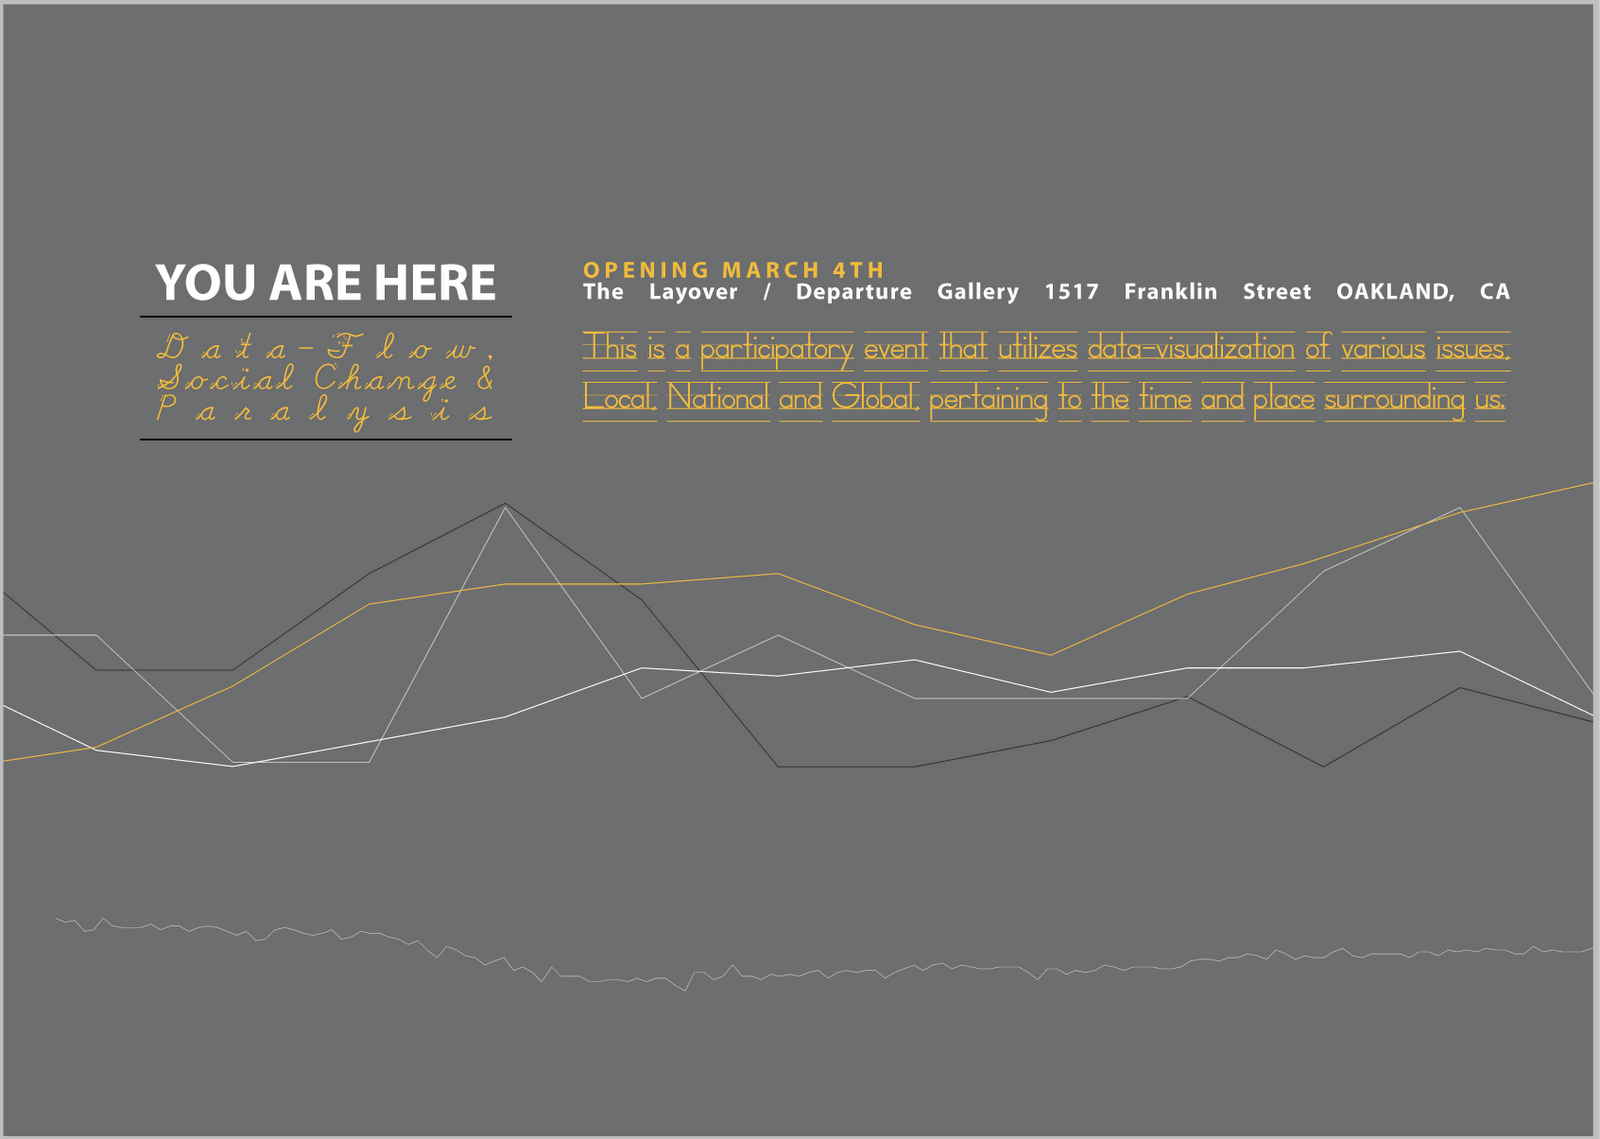
HERE IS WHAT TO EXPECT:
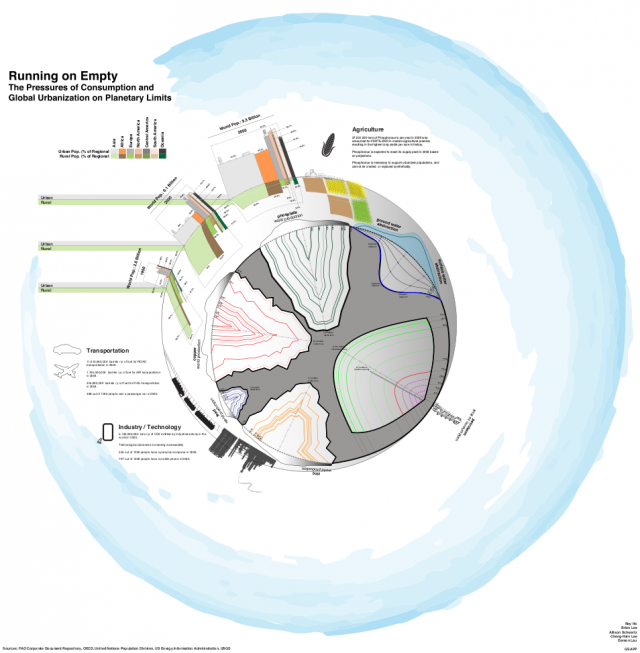
This is a participatory event that utilizes data-visualization of various issues, local, national and global, pertaining to the time and place surrounding us. The utility of various data mash-ups creates perspective and new way of looking a issues, meanwhile it is an attempt at making sense of what it is to create social change in a world where we are constantly bombarded with more information than we can process. In opposition to the dominant paradigm that “the truth will set you free” I propose “the truth will give you anxiety and paralysis” This project is an active dialogue between these two ideas with the attempt to provide a forum for people to put forth their own ideas of how they would like to solve problems pertaining to their world.
Been looking at data visualization projects. Many present an interesting intersection between Art Politics and Technology. Moreover, its they create an new perspective to talk about and see aspects of the world we live in.

Here is an example of one such project:
“In recent years, as the U.S. prison population has soared, million-dollar blocks have popped up in cities across the country. Maps of prison spending (like the one on the left) suggest a new way of looking at this phenomenon, illustrating the oft ignored reality that most prisoners come from just a handfulof urban neighborhoods. These maps invite numerous questions: How is the community benefiting from all the money being spent? And might there be another, better way to spend those same criminal-justice dollars?”
Link to Project
For inspiration:
http://www.visualizing.org/
“We created Visualizing.org because we want to help connect the proliferation of public data… with a community that can help us understand this data… with the general public.”
Interesting study on how people use all that green space in Berlin.
http://www.urbandialogues.de/index.php?page=parking

“The Wall Park, where the borderline between East and West splitted the city in two pieces from 1961-1989 functions as a gathering place for the younger generation before night clubbing”
Done by the organization Urban Dialogues:
The non-profit art organization metropolitan urban
dialogues is treating questions of urban change and
flux during the last twelve months through a series of
site-specific projects in Berlin and participatory arts
projects in other European metropolis.
http://www.urbandialogues.de/